Hitting in Major League Baseball has reached unprecedented levels of difficulty in 2026. Starting pitchers, such as Jacob Misiorowski, are showcasing exceptional talent by delivering fastballs at 104 mph, paired with deadly 93 mph sliders. Just a decade ago, the average fastball velocity across the league stood at 93 mph. Misiorowski’s prowess is evident through his first 15 starts this year, allowing only 15 earned runs.
Relievers are also making a significant impact. Mason Miller, the closer for the San Diego Padres, is setting remarkable records, having allowed a mere three earned runs across 32 innings. Facing 123 batters this season, Miller has struck out 63 of them. His hard-hit percentage allowed stands at an impressive 7%, compared to the league average of around 40%.
The level of dominance exerted by Misiorowski and Miller is exceptional, but it’s reflective of a broader trend where pitching continues to surpass hitting. The refinement of pitch development has become scientific, with the abundance of data enabling players to optimize their mix of pitches.
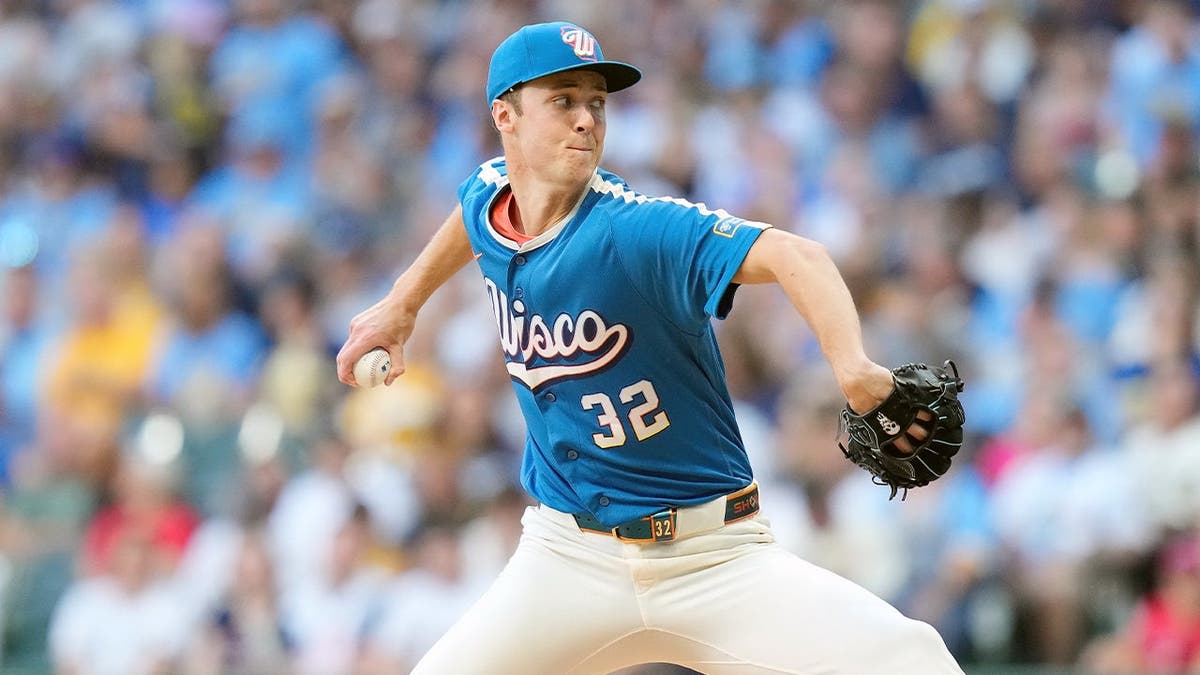
Brewer Misiorowski’s Record-Breaking Pitch Speed
Milwaukee Brewers pitcher Jacob Misiorowski recently lit up the record books by delivering a pitch at 104.5 mph, marking the fastest pitch ever thrown by a starter. Such feats showcase the evolving landscape of pitching in MLB.
Despite these advancements in pitching, offensive performance has unexpectedly surged over the past month. How is this possible amidst the advantages enjoyed by pitchers?
The answer lies in alterations to the baseball itself. Eno Sarris from The Athletic has identified changes in drag on the baseball, which have reached their lowest point since 2019. Reduced drag translates to less resistance for the ball as it travels through the air, allowing it to fly farther. The 2019 season was marked by spectacular offensive displays, with 10 players achieving 40 or more home runs and 58 players hitting 30 or more. The league’s collective batting average was .252/.323/.425 that year. By 2025, with increased drag, this decreased to .245/.315/.404, indicating a 21-point reduction in slugging percentage.
Further research by Sean Zerillo on X reveals a substantial surge in offensive analytical data recently. He noted that “barrel distance increased by +10.2 ft from April 2026 to present,” marking the most significant in-season increase of the Statcast era from April to June. Typically, weather-related increases average only 4.6 feet. Zerillo’s findings indicate a perfect correlation between the six-foot increase and the reduced drag initiated in early June.
Weather’s Minimal Impact
Interestingly, even in domed stadiums or games with closed roofs, the ball’s travel distance increased by 10.4 feet, eliminating weather as a major factor.
While there are annual fluctuations in the baseball itself, MLB controls its production and has humidors installed at all 30 stadiums. There is no evidence suggesting Commissioner Rob Manfred specifically demanded reduced drag. Production tolerances might shift, contributing to these findings. MLB has openly pursued more offense, evident through 2023 rule changes prohibiting shifts and initially boosting runs per game from 4.28 in 2022 to 4.62 in 2023. However, the average declined again to 4.45 by 2025. It is plausible that the league has aimed to balance the playing field with lower-drag baseballs.
While pitching duels delight purists, many casual fans attend games to witness home runs from stars like Shohei Ohtani, Aaron Judge, or Juan Soto. The extra six feet of distance compared to previous years significantly increases the likelihood of home runs. Whether a ball falls short at the warning track or surpasses the fence hinges on this distance. The upcoming storyline is whether this trend will persist through October when home runs hold maximum value.
Ian Miller at OutKick explores these dynamic shifts in Major League Baseball.