
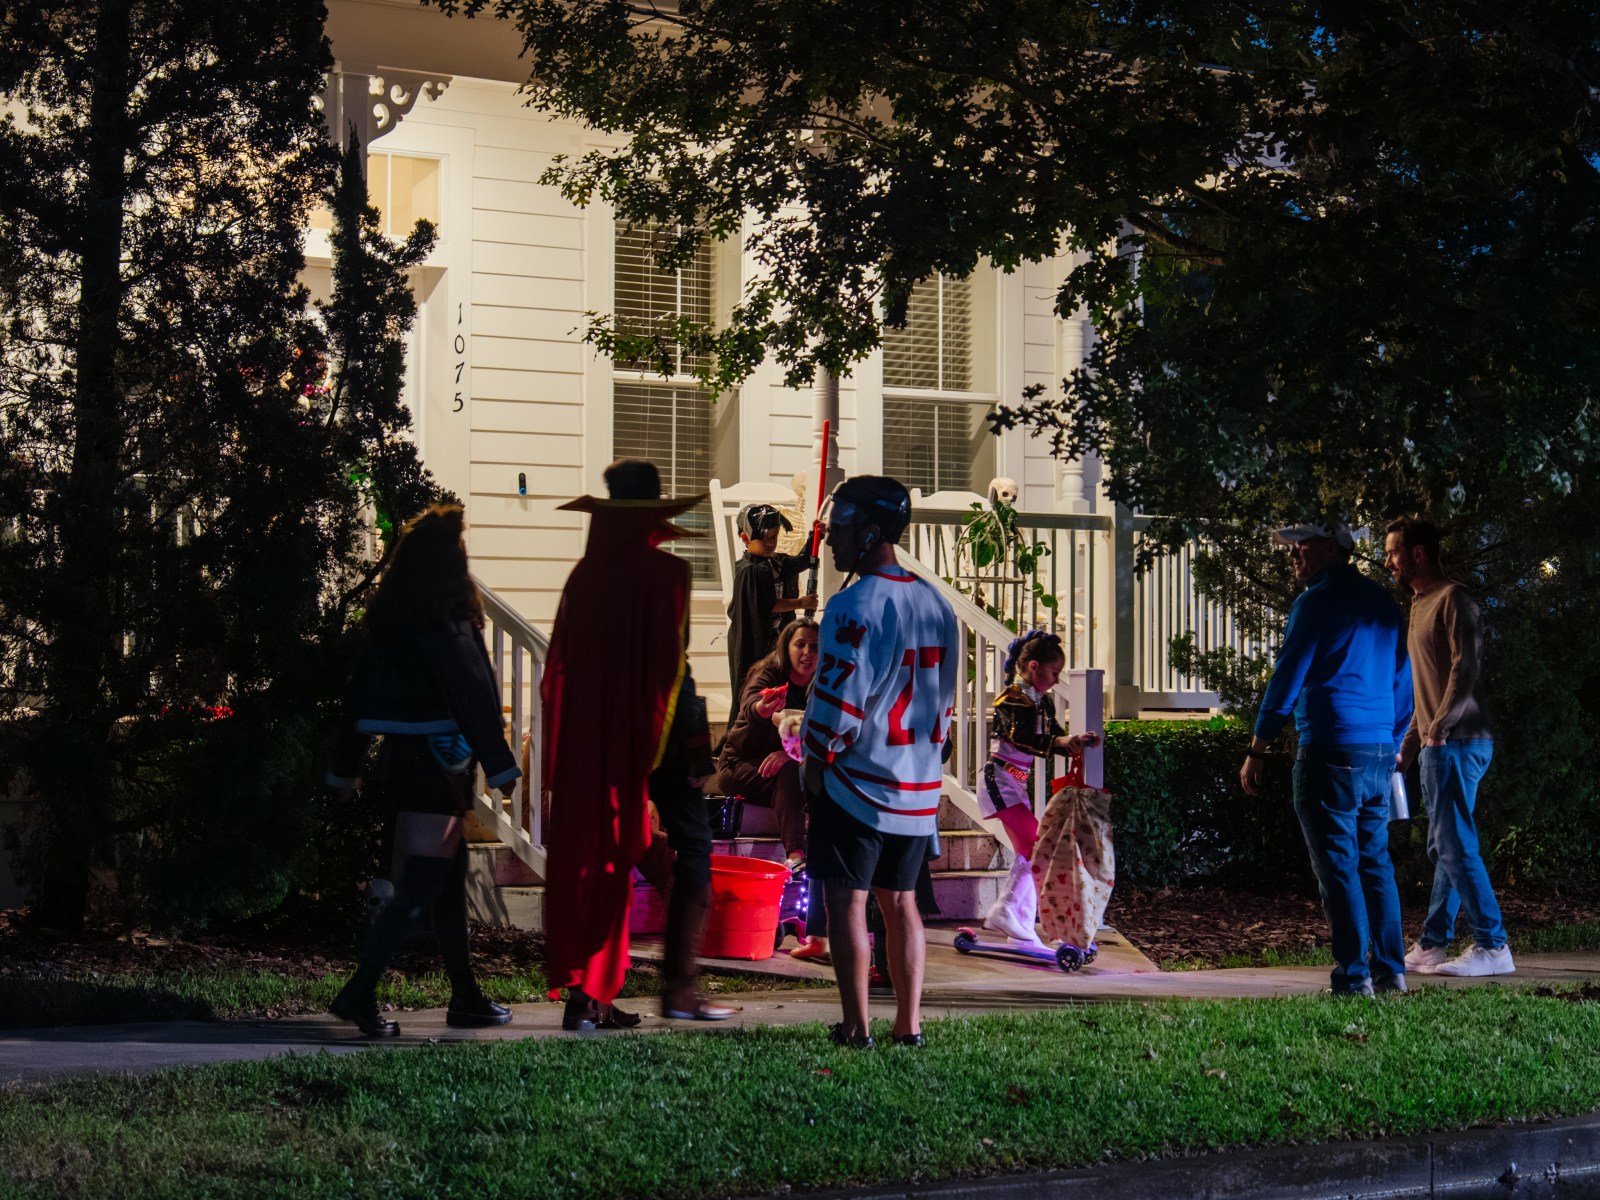
Halloween remains a beloved holiday in the U.S., characterized by dressing up in costumes and enjoying sweet treats. This year, the National Retail Federation anticipates Americans will spend approximately $13.5 billion on Halloween festivities, surpassing last year’s figures slightly. A significant portion, about $4.1 billion, will be allocated to candy purchases. On average, each person is expected to spend $115.14, with 96% of shoppers planning to buy candy.
The candy finds its way into jack-o’-lantern buckets and pillowcases, making trick-or-treating a key aspect of Halloween. However, not all states are equally favorable for trick-or-treaters. Using data from the National Retail Federation, the Census Bureau, and the National Centers for Environmental Information, Spokeo ranks all 50 states based on their trick-or-treat quality to help you anticipate your candy haul on October 31.
Trick-or-treating success involves more than chance; several underlying factors contribute to the quality of the experience. Ideal neighborhoods include those densely populated with homes close together, featuring plenty of children and lit walkways to simplify knocking on doors.
How the Index Is Built
Spokeo’s index assesses each state based on four main conditions using federal Census and weather data. Scores for each component range from 0 to 100, with top states earning a score of 100 in each category. These scores are weighted and combined to form a single index score. The components are:
- Households with children under 18: The presence of children drives trick-or-treating demand. This component uses percentages from the Census Bureau’s 2020 to 2024 American Community Survey (Table B11005), focusing on households with kids.
- Housing density in populated tracts: More housing units within walking distance offer more candy opportunities. The index calculates housing units per square mile for households in census tracts, utilizing data from Table B25001 and TIGER/Line tract geography.
- Single-family detached share: Detached houses with front walkways are ideal for trick-or-treating. The index examines single-family detached housing units as shown in Table B25024.
- Weather patterns: Weather significantly impacts trick-or-treating, as rain can deter participation. The NOAA’s 1991 to 2020 climate normals for Oct. 31 consider average temperature and rain probability.
Where To Go This Halloween
Spokeo’s heatmap indicates trick-or-treating quality varies by location. Utah ranks first, followed by Texas, Oklahoma, California, and Mississippi. Utah stands out with 38% of households having children, while Texas follows with 35%. California excels in three components: children’s population, housing density, and weather. Oklahoma ranks second for single-family housing at 73%, and Mississippi offers favorable 60-degree weather.
Idaho presents a unique case, leading the nation in single-family housing at 74% and ranking fourth for households with children, yet misses the top five.
What the Index Can’t See
No index perfectly captures the essence of a good Halloween night. The index doesn’t account for households that don’t distribute candy, street safety, traffic, or organized trick-or-treat events. State-level data overlooks contrasts between dense cities and sprawling suburbs.
Nonetheless, states with abundant children, proximate homes, and mild weather, like Utah and Texas, offer more chances of a successful candy haul. If your state ranks low, rest assured Halloween spending is expected to rise compared to last year, ensuring a plentiful candy supply.
This analysis was provided by Spokeo and reviewed by Stacker.