
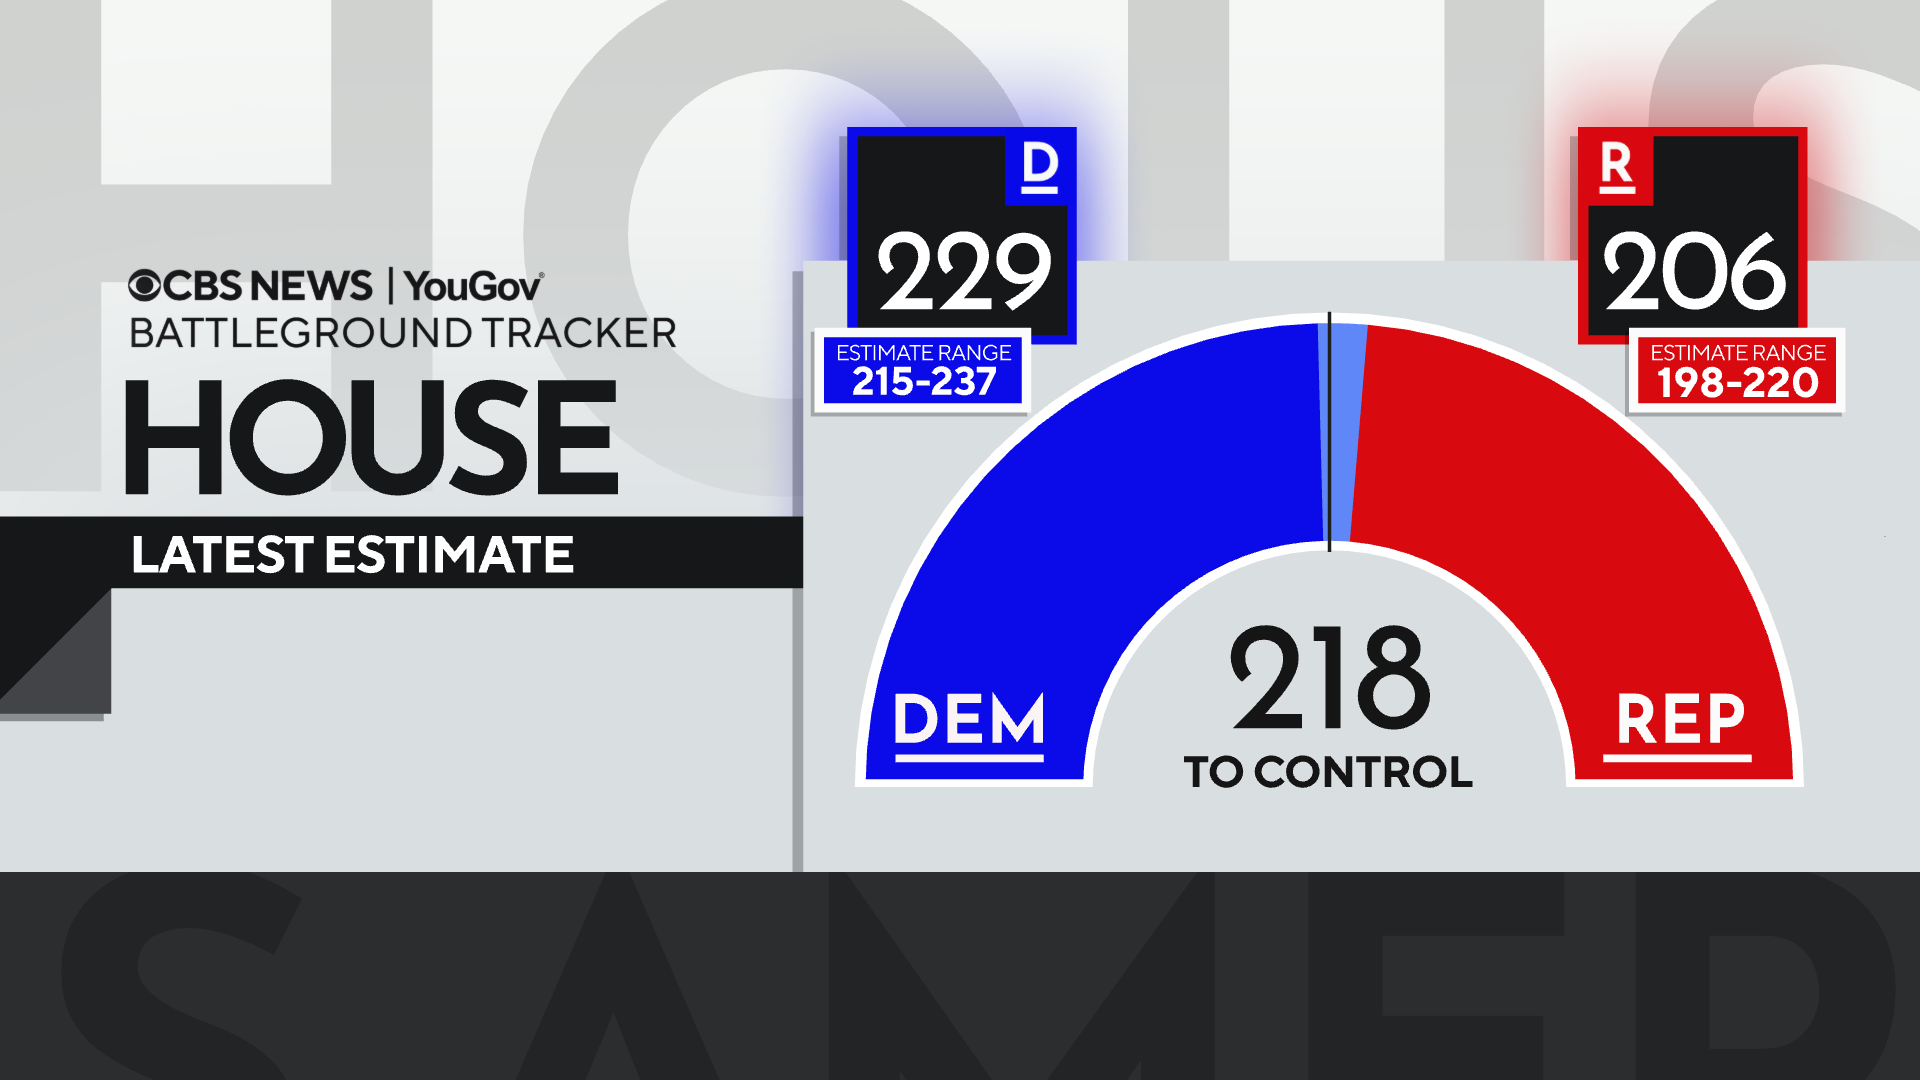
The upcoming election is characterized by avoidance, with voters motivated more by preventing outcomes they dislike than gaining benefits. Amid concerns about inflation and the economy, Democrats still lead in the pursuit of a House majority. They are projected for 229 seats according to CBS News’ model, translating preferences into seats. The outcome range could stretch into the 230s, but Republicans have a slim path to retain the majority.
Although the Democratic lead is steady, it hasn’t grown. No significant wave has formed. Undecided voters appear more Republican; their turnout might be pivotal. Voters are driven to act against anticipated outcomes. For example:
- More think gas prices will rise if Republicans win than if Democrats do, though few believe Democrats will lower them.
- Most feel Democrats lack a plan and won’t improve financial conditions, yet more fear worsening under Republicans.
The president remains a key factor. A substantial number may vote in the midterm to support or oppose him. Many Democrats are motivated by opposition to President Trump or Republicans rather than supporting Democratic policies. This motivation’s impact on Democratic gains is uncertain.
Democrats show higher early voting intent, contrasting with Republicans more likely to be undecided voters. If these Republicans gain motivation, the situation might change.
If either party wins, few believe gas prices will drop. Republicans face a connection with rising prices, as more anticipate increases if they win. Overall financial outlooks remain pessimistic. More voters expect improvement under Democrats, though cynicism pervades.
Most foresee increased corruption if Republicans hold Congress. Both parties’ voters broadly acknowledge corruption as election motivation. The Trump factor heightens motivation for both sides, more for Democrats who vote significantly to oppose him. Republican voters support Trump to a lesser extent.
Democratic motivation leans heavily on stopping Trump and GOP policies, questioning Democrats’ plan clarity. Four in ten Democrats and Republicans see no clear party plan. Motivation stems from Trump opposition for many Democrats, while some Republicans, not strongly approving Trump, still oppose Democrats.
Other Issues
Many voters view the opposing party’s victory as a lifestyle threat. Democrats see a Republican win as threatening, especially for MAGA Republicans. While other issues rank lower, Republicans lead among those prioritizing transgender issues.
Immigration
One-third of voters believe Democrats prioritize recent immigrants over citizens, supporting Republicans significantly. Another third think Democrats balance priorities, supporting Democrats.
Trump and Finances
Negative economic assessments persist, dipping recently. Most likely voters feel the president’s policies worsen personal finances, with top concerns on the economy and inflation.
Those viewing inflation as crucial lean toward Democrats, as do those facing financial hardship. Voters worry about whose financial interests the president prioritizes, seeing more self-interest over national in his priorities. Those holding this view back Democrats, contrasting with Republicans seeing Trump prioritizing national over personal financial interests.
Trump on the Trail
The president’s campaign appearances might energize Republican base support but may not sway broader support. MAGA Republicans feel increased voting likelihood, non-MAGA less so.
The Voting Process
Most voters express some confidence in local election processes, including ballot counting and eligibility checks. Confidence in accurate vote recording is also higher among Democrats. Republicans more frequently suspect illegal voting in federal elections.
Survey conducted by CBS News and YouGov with 2,355 U.S. adults between October 21-23, 2026. The sample represents national demographics from the U.S. Census and other surveys, with a margin of error of ±2.6 points for all adults, ±2.9 for registered voters, and ±3.0 for likely voters. Estimates use a CBS News and YouGov model, incorporating data from this poll, past votes, and district characteristics. Error calibration considers historical polling accuracy, producing seat estimate ranges with 95% confidence intervals.