
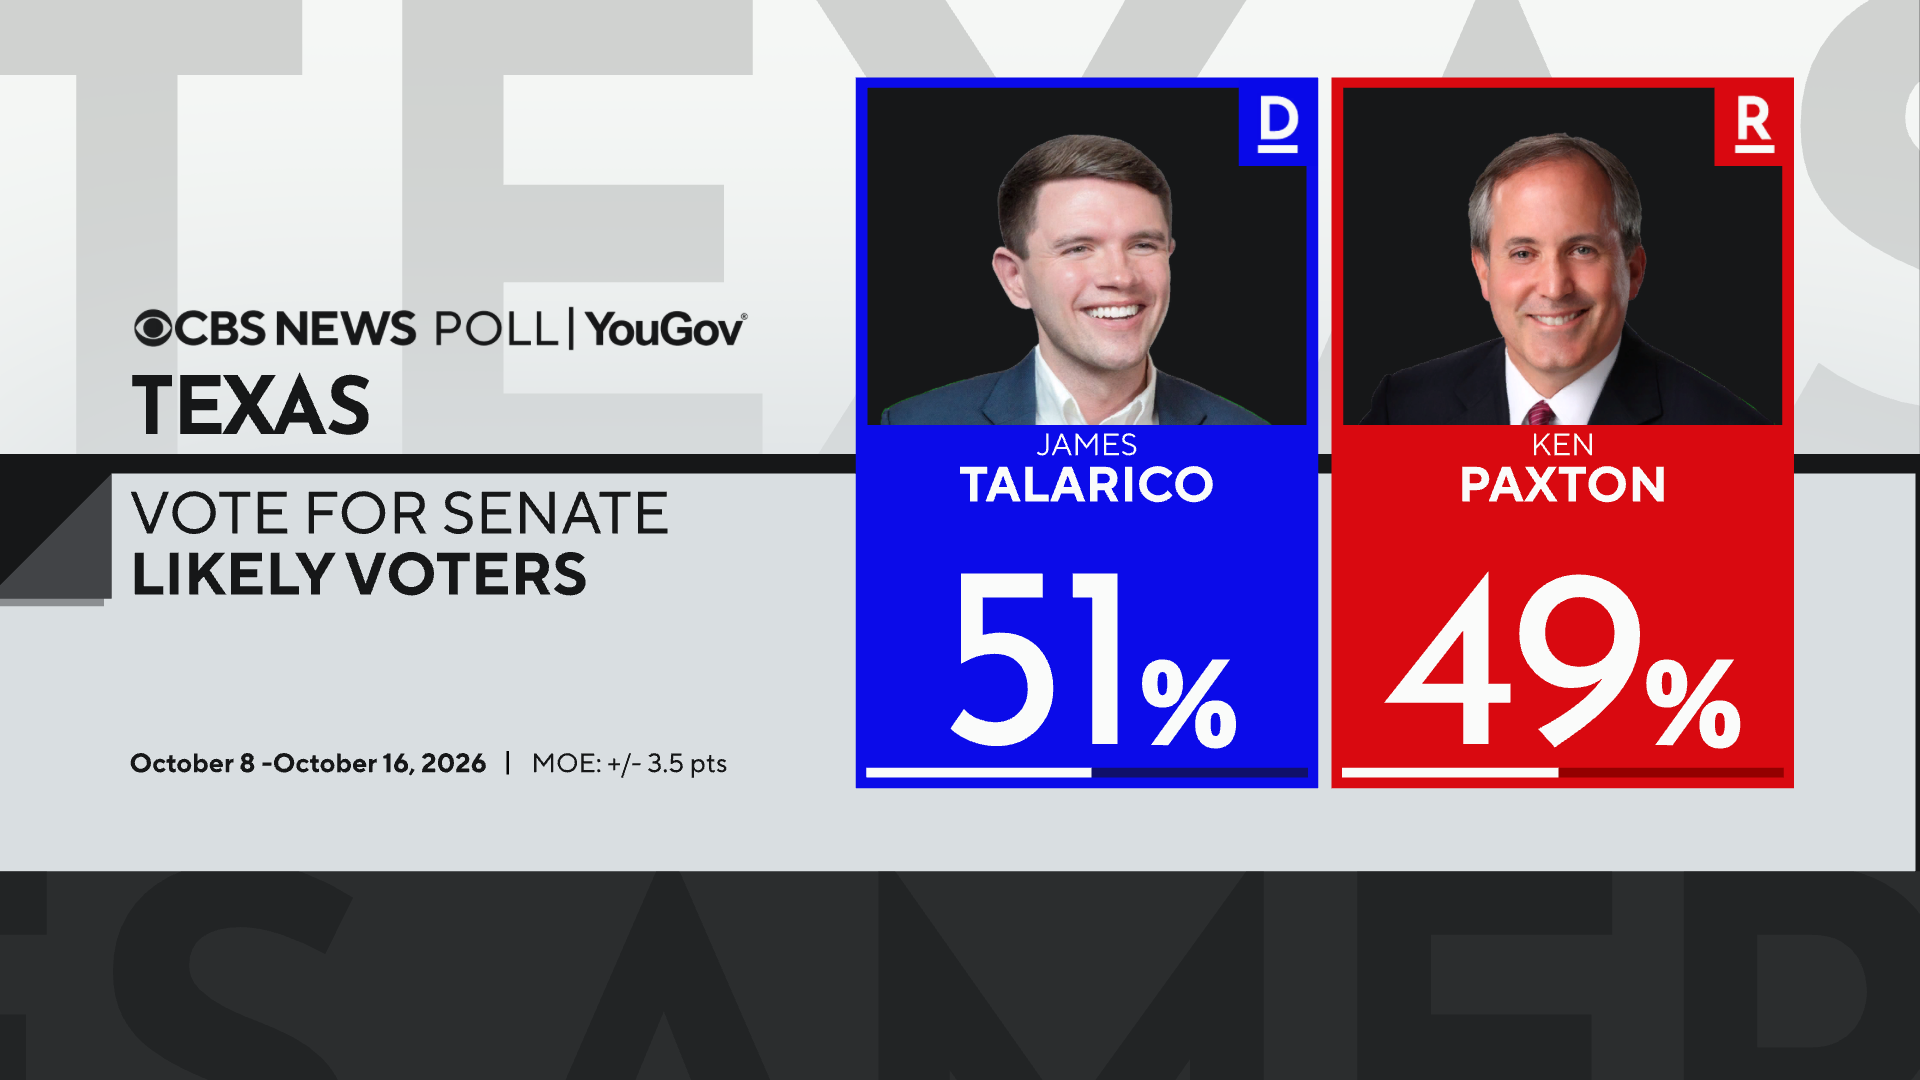
The Texas Senate race presents a significant challenge as Republican Ken Paxton faces Democrat James Talarico, with both candidates essentially tied in a contest that hinges on voter turnout.
Paxton benefits from Texas’s Republican tilt. However, Talarico gains support from voters’ concerns about the economy and perceptions of his personal character. Democrats appear more committed to voting, giving Talarico an edge that might shift with increased Republican turnout.
Paxton’s supporters predominantly favor him for party allegiance, opposition to Talarico, and support for former President Trump. Economic issues, particularly the cost of living, dominate voters’ concerns, with many affected by rising prices—among these voters, Talarico leads significantly. His personal qualities resonate with supporters more than Paxton’s.
Some voters who never side with Democrats are breaking tradition to support Talarico, including 5% of Republican identifiers and 9% of anti-Democrat voters.
Paxton benefits from local support for the Trump administration’s deportation policy, contrasting national sentiments. Republicans perceive Talarico’s policies as threatening their cultural values, while Democrats share similar feelings towards Paxton.
The demographic landscape shows more Republicans than Democrats in Texas. Talarico must capture a majority of independent votes, shift some Republican support, or engage new voters to counteract Republican dominance. Younger voters favor Talarico but typically exhibit lower turnout rates. Latino voters, affected by economic hardships, largely view Talarico as the suitable candidate, showing a shift from previous preferences.
In the gubernatorial race, incumbent Greg Abbott holds an advantage over Democrat Gina Hinojosa, even garnering support from some Talarico voters.
This analysis is based on a CBS News/YouGov poll conducted with 1,492 registered Texas voters from October 8-16, 2026. The survey is adjusted for demographic factors and previous voting behavior, with a margin of error of ± 3.4 points for registered voters and ± 3.5 points for likely voters.